GraphStudio
GraphStudio – The simple, yet powerful GUI that powers TigerGraph
GraphStudio Features
TigerGraph’s powerful graphical user interface (GUI) — GraphStudio™ — brings together all elements of graph data analytics, integrating them into a single, simple, and highly usable application.

Visual drag-and-drop database structure (Schema) designer
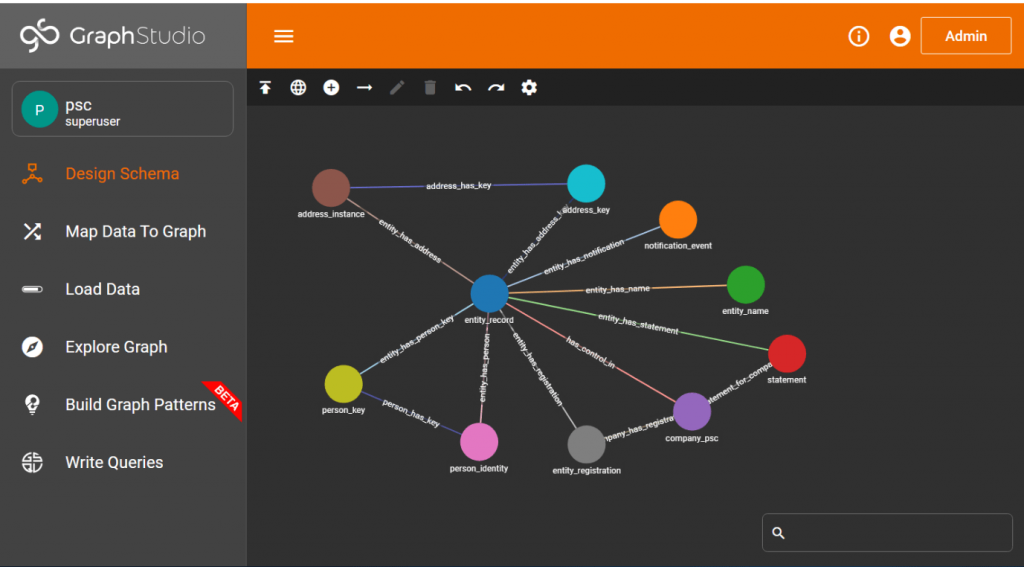
GraphStudio utilises a visual drag-and-drop database structure designer that provides simple entity-relationship diagramming.

The graph data model (vertex types and edge relationship types) are objects connected to other objects by connections known as edges.
Visual Data Loading
With this component, you can identify your input files, then make connections between the input column and the graph attributes.

Visual Query Builder
This component provides you with a visual way to build your graph business logic. By creating visual patterns utilising the drag-and-drop function, you can intuitively represent the questions you’re asking — meaning you no longer need to write GSQL code in these cases.
Visual Query Builder turns GraphStudio into a complete software development kit, where users can create entire graph applications without needing to write any code at all.
Easily analyse output
GraphStudio lets you analyse outputs the way you prefer, either graphically, or as structured text.
GSQL™
A key feature of TigerGraph’s software is an editor that shows syntax highlighting to help you design queries and analyses faster and more accurately.
Modular and Integrated
On-premises users have the ability to choose between any GraphStudio component or the equivalent direct coding based method.

