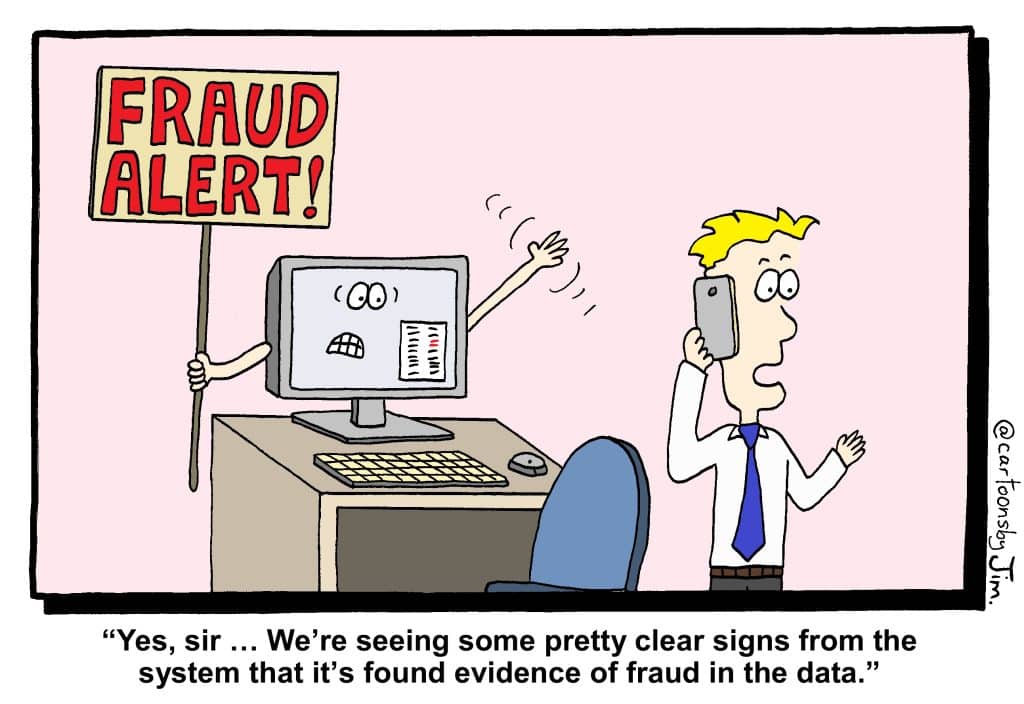
There’s a well-known saying: “Can’t see the forest for the trees”, the meaning of which is easily understood. That is, if you focus too much on the small details, you won’t see the big picture. It’s a helpful maxim for life and business.
But what if you find yourself in a situation where the tiny details are incredibly important? What if you find your business has become the victim of fraudulent activity?
The nature of fraud is that it is all about deception – hiding wrongdoing in the details of business communications and transactions by someone trying to make illicit financial gains.
Clearly, to address problematic situations like this, you need to be able to make the connections between the pieces of information that together reveal evidence of fraudulent activity.
But, like the proverbial forest, when it comes to finding fraud in business data, it’s easy to get lost in the trees – and when you need to find those tiny individual parts of the forest that are causing a problem, it’s going to be difficult.
So, what can you do to find fraud in the forest of your data? What tools will help you get down into the weeds of the forest to root out the problem?
Finding Fraud in Insurance
The complexity that comes with finding fraud in massive data sets can be clearly seen in the insurance sector.
Be it health, home and contents, or compulsory third-party insurance for vehicles, the general insurance market in Australia was estimated at over $61B in 2021 and continues to grow every year.
While the precise value of fraudulent insurance claims is difficult to estimate, there are statistics that shine some light on the extent of the problem.
For example, the Insurance Council of Australia reported in 2017 that insurers collectively detected $280 million in fraudulent claims across all types of insurance classes, excluding health insurance or personal injury – and that was just the amount of fraud actually detected.
Obviously, determining how much fraud is ‘successful’ – that is, undetected – is well-nigh impossible. However, the ICA has estimated that “anywhere from 4% upward of claims made involve some form of insurance fraud.” [Source]
Due to the complex nature of insurance and the significant amounts of data involved in processing claims, it is a common target for fraud by dishonest individuals.
Be it compulsory third-party insurance holders trying to make claims for injuries they never received, excess charges, or simple overservicing of health insurance claims, the ‘devil’ of insurance fraud is always found in the details.
What’s clear is that the cost of fraud, regardless of whether it is pre-meditated or simply opportunistic, adds to the overall cost of claims and thus, raises the costs of premiums for consumers.
As such, insurance providers need effective tools to be able to sift through those details to identify instances of fraud and so ensure the sustainability and ongoing affordability of their schemes.
Encouragingly, a technological tool has emerged with the power to identify anomalies in insurance claims data that could be fraudulent, and so significantly improve compliance and reduce new instances of fraud.
That tool is the graph database.
The Tiger in the Forest
The graph database is software that works by finding common attributes and connections between millions of data points, analysing them to identify patterns and commonalities, such as names, addresses, phone numbers and/or IP addresses.
At Intech, we utilise the powerful graph database tool developed by TigerGraph in our locally developed solution IQ Office, which has direct applicability as a solution for finding insurance fraud.
TigerGraph differentiates itself from other data analysis products in its scalability for reviewing billions of data points in real-time and performing deep link analytics, which then provides visual representations of the relationships between data points.
Here’s how it can work to find fraud in insurance claims:
- In the data sets of any insurance provider, TigerGraph will be triggered by the entry of a new claim. It will then ‘interrogate’ the historic claim database looking for relationships based on selected indicators.
- A potential fraud scenario could involve a CPT insurance claim, where two individuals, a Claimant and an Independent Witness, who are both identified in two separate insurance claims where the same ‘not at fault’ vehicle and driver is recorded in both claims. Such an indicator would register with TigerGraph, effectively raising suspicions that a fraudulent claim is being made.
- The solution would then provide a visual display of all historic incidents and claims that are linked to the parties of the new claim, and in so doing, make it easy to spot instances where previous claims have already been made, thus confirming the new claim is most likely fraudulent.
The reality is that the capacity to look through so many data points and make such meaningful connections in a time-efficient and reliable way is simply beyond both the capability of the human brain and most other technology tools developed to date.
Talk about not being able to see the trees because of the forest. With TigerGraph, getting to the root of fraud is no longer a problem.
Intech Solutions specialises in developing applications of TigerGraph’s powerful data analysis capabilities for a wide range of clients who need to better understand the relationships between the entities in the forests of their data. We will work closely with your staff and your data to test and confirm solutions that deliver for your specific needs.
Contact us today on 02 8305 2100 for a confidential discussion on how we can deliver fraud prevention solutions for your business with TigerGraph.

Intech provides data solutions that lay a secure foundation for robust, cost-effective and timely business transformation. Intech’s products have been successfully deployed to thousands of users, across hundreds of sites. See intechsolutions.com.au


